Note
Go to the end to download the full example code
Multiscaling with triangle meshes
We use the skshapes.Multiscale class to create a multiscale decomposition of a triangle mesh. This is useful to accelerate some processing steps, such as multigrid simulations or level-of-detail rendering.
First, we load the Stanford bunny as a triangle mesh.
import pyvista as pv

import skshapes as sks

bunny = sks.PolyData(pv.examples.download_bunny())
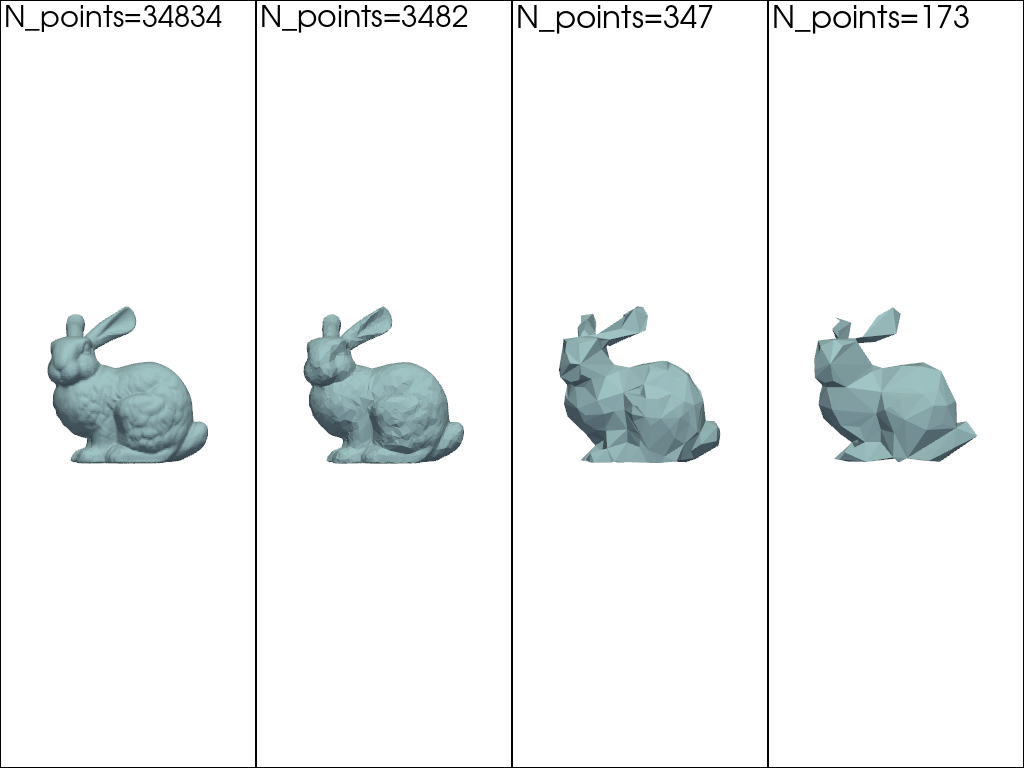
Then, we create the multiscale representation with different sampling ratios.
multiscale_bunny = sks.Multiscale(shape=bunny, ratios=[0.1, 0.01, 0.001])
Under the hood, we rely on quadric decimation (Garland and Heckbert 1997) to reduces the number of vertices, iteratively collapsing the edge with the smallest approximation error. This algorithm is implemented by the fast-simplification package.
pl = pv.Plotter(shape=(2, 2))

for i, ratio in enumerate([1, 0.1, 0.01, 0.001]):
    # Use the '.at()' method to access the shape at different scales
    sampled_bunny = multiscale_bunny.at(ratio=ratio)

    pl.subplot(i // 2, i % 2)
    sks.doc.display(
        plotter=pl,
        shape=sampled_bunny,
        show_edges=True,
        title=f".at(ratio={ratio}), {sampled_bunny.n_points:,} points",
    )

pl.show()
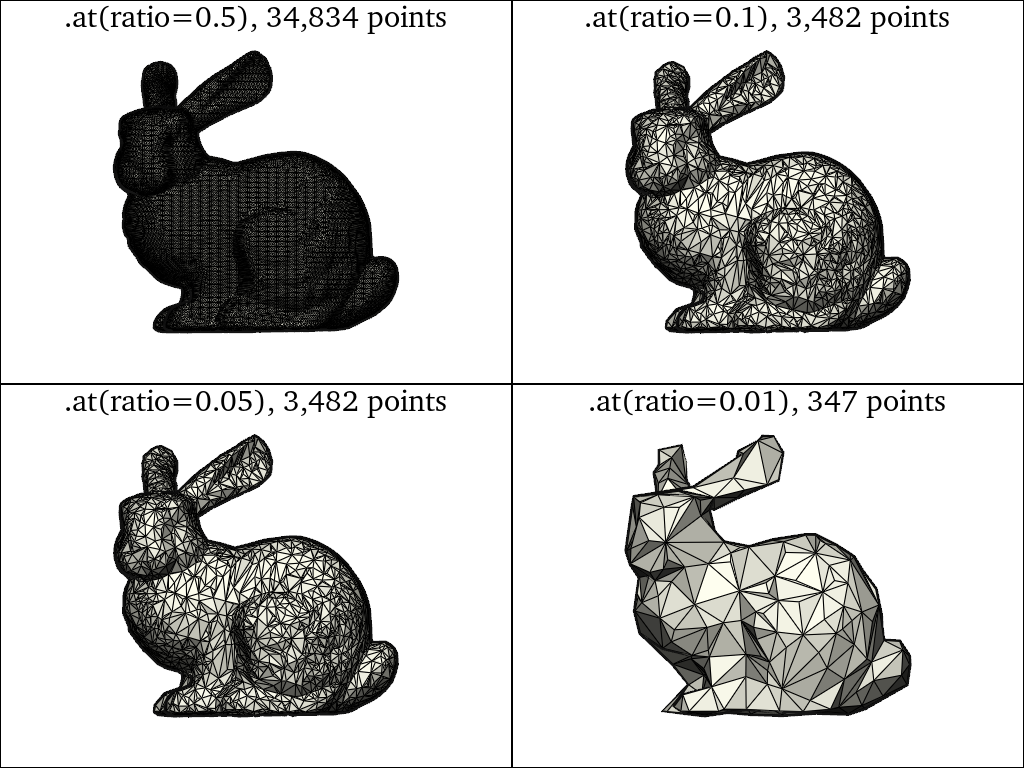
Please note that calling the at() method with an arbitrary ratio
returns the most compact (i.e. the coarsest) representation stored
in the Multiscale object that is
at least as detailed as the specified ratio.
pl = pv.Plotter(shape=(2, 2))

for i, ratio in enumerate([0.5, 0.1, 0.05, 0.01]):
    # Use the '.at()' method to access the shape at different scales
    sampled_bunny = multiscale_bunny.at(ratio=ratio)

    pl.subplot(i // 2, i % 2)
    sks.doc.display(
        plotter=pl,
        shape=sampled_bunny,
        show_edges=True,
        title=f".at(ratio={ratio}), {sampled_bunny.n_points:,} points",
    )

pl.show()
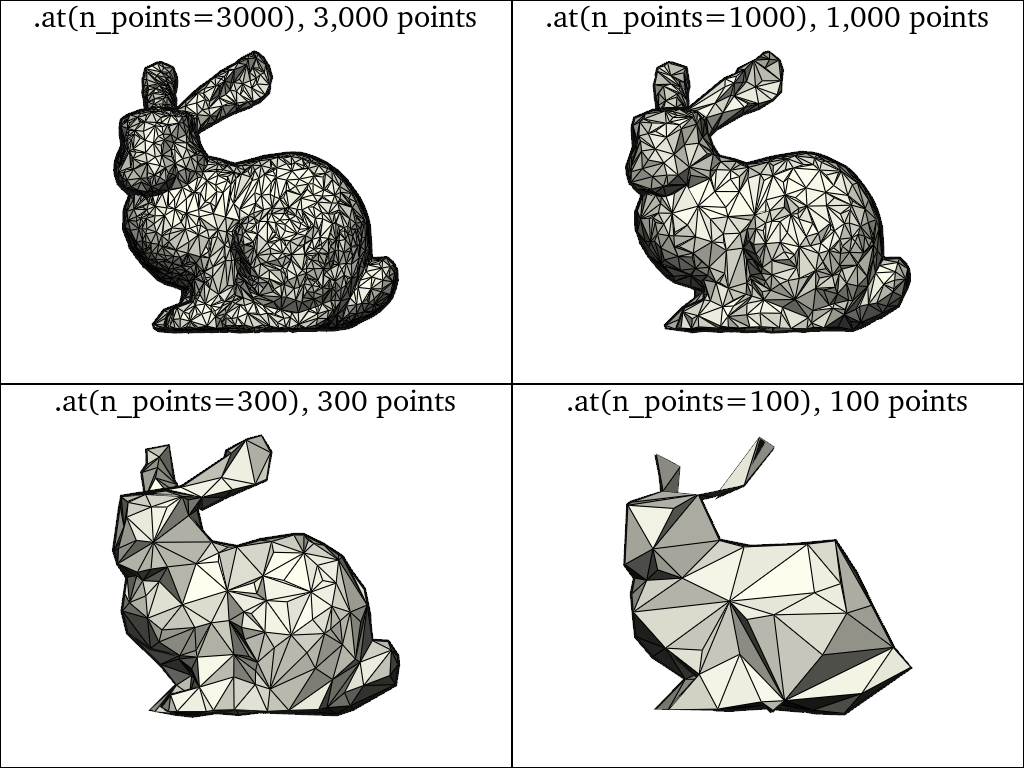
Alternatively, we can use the n_points parameter to specify the desired
number of points per resolution level.
multiscale_bunny = sks.Multiscale(shape=bunny, n_points=[3000, 1000, 300, 100])

pl = pv.Plotter(shape=(2, 2))

for i, n_points in enumerate([3000, 1000, 300, 100]):
    # Use the '.at()' method with the n_points parameter instead of ratio
    sampled_bunny = multiscale_bunny.at(n_points=n_points)

    pl.subplot(i // 2, i % 2)
    sks.doc.display(
        plotter=pl,
        shape=sampled_bunny,
        show_edges=True,
        title=f".at(n_points={n_points}), {sampled_bunny.n_points:,} points",
    )

pl.show()
Total running time of the script: (0 minutes 5.995 seconds)