Note
Go to the end to download the full example code
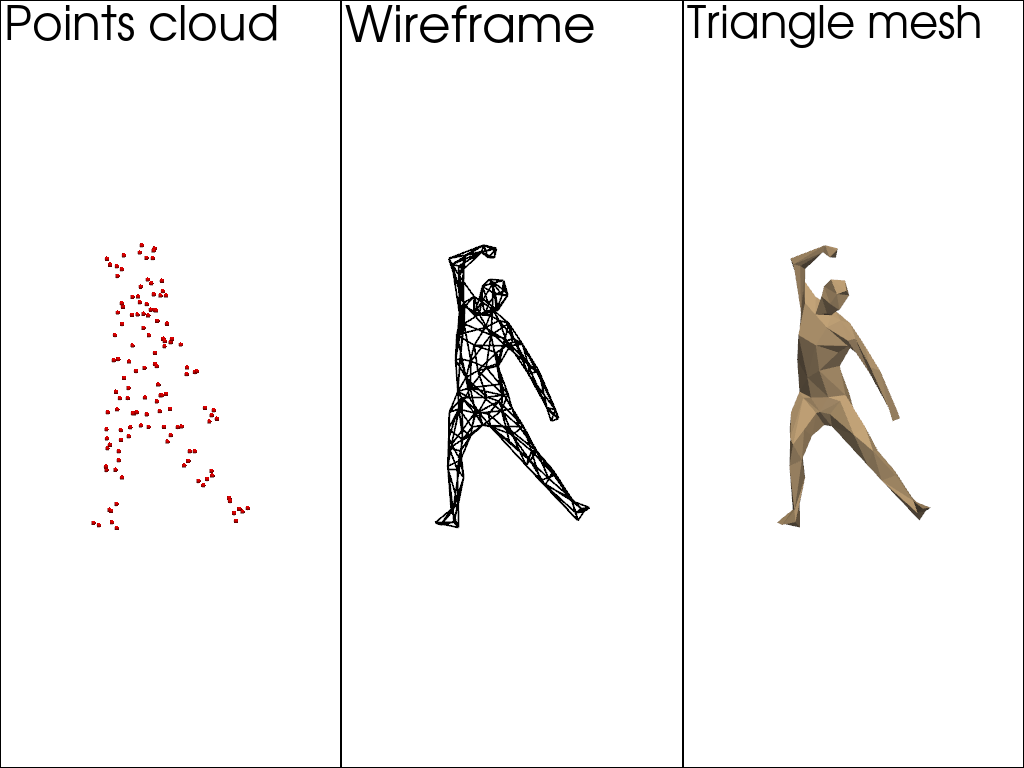
The PolyData class: point cloud, wireframe and triangle meshes
This notebook describes the PolyData class, the common class for point clouds, wireframe and triangle meshes.
Load and create PolyData
Plot PolyData with PyVista
Add a signal
Add landmarks
Add control points
Save the object and load it back
- PolyData creation
- There are two ways to create a PolyData object:
from a file
explicitly with points, edges (optional), triangles (optional)
import pyvista as pv

import skshapes as sks

cpos = [(-1.6657788922829617, 7.472045340108491, 3.9439767221656665),
 (0.8380894707515836, -0.003572508692741394, -0.002311795949935913),
 (0.9587598899863243, 0.2457800580099367, 0.14272924170625823)]


# Load a mesh from a .ply file
mesh = sks.PolyData("../data/human/human.ply")

# Extract the points, edges and triangles from the mesh
points, edges, triangles = mesh.points, mesh.edges, mesh.triangles

# Create a point cloud, a wireframe and a surface mesh from the points, edges and triangles
points_cloud = sks.PolyData(points=points)
wireframe_mesh = sks.PolyData(points=points, edges=edges)
surface_mesh = sks.PolyData(points=points, triangles=triangles)

# Create a plotter with 3 subplots and display the point cloud, wireframe and surface mesh
# PolyData objects can be converted to pyvista objects with the to_pyvista method
plotter = pv.Plotter(shape=(1, 3))
plotter.subplot(0, 0)
plotter.add_text("Points cloud", font_size=24)
plotter.add_mesh(points_cloud.to_pyvista(), color="red", render_points_as_spheres=True)
plotter.camera_position = cpos
plotter.subplot(0, 1)
plotter.add_text("Wireframe", font_size=24)
plotter.add_mesh(wireframe_mesh.to_pyvista(), color="k", line_width=2)
plotter.camera_position = cpos
plotter.subplot(0, 2)
plotter.add_text("Triangle mesh", font_size=24)
plotter.add_mesh(surface_mesh.to_pyvista(), color="tan")
plotter.camera_position = cpos
plotter.show()
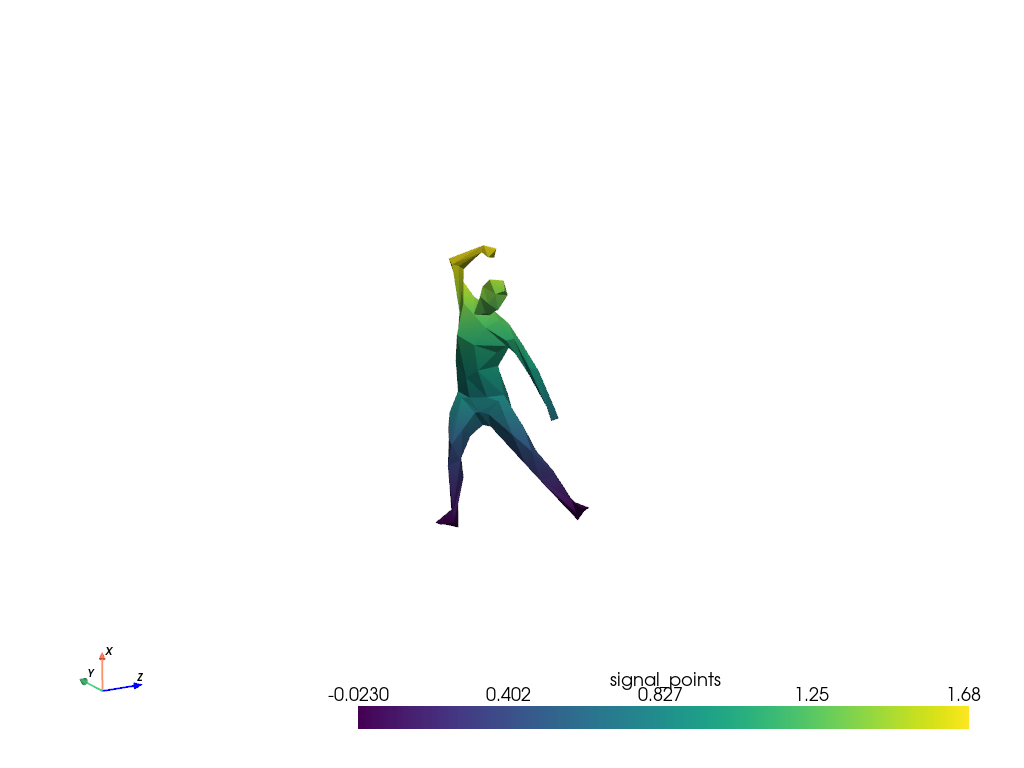
Add signals
Signals can be added to the PolyData object through point_data, edge_data or triangle_data.
The size of the array in the first dimension is expected to match n_points, n_edges or`n_triangles`.
import torch

# Add some user-defined data to the mesh
surface_mesh.triangle_data["signal_triangles"] = torch.rand(surface_mesh.n_triangles, 3)
surface_mesh.edge_data["signal_edges"] = torch.rand(surface_mesh.n_edges, 3, 3)
surface_mesh.point_data["signal_points"] = surface_mesh.points[:, 0]

# Some features are already available in the mesh object
surface_mesh.triangle_data["centers"] = surface_mesh.triangle_centers
surface_mesh.triangle_data["areas"] = surface_mesh.triangle_areas
surface_mesh.edge_data["centers"] = surface_mesh.edge_centers
surface_mesh.edge_data["lengths"] = surface_mesh.edge_lengths

# Call the plot method display information about the signal data (size, type, device)
print("Triangle_data:")
print(surface_mesh.triangle_data)

# Point_data can be used in the plot method to color the surface mesh
surface_mesh.plot(scalars="signal_points", cpos=cpos)
Triangle_data:
DataAttributes Object with attributes:
- signal_triangles: torch.Size([250, 3]), torch.float32
- centers: torch.Size([250, 3]), torch.float32
- areas: torch.Size([250]), torch.float32
Number of elements: 250
Device: cpu
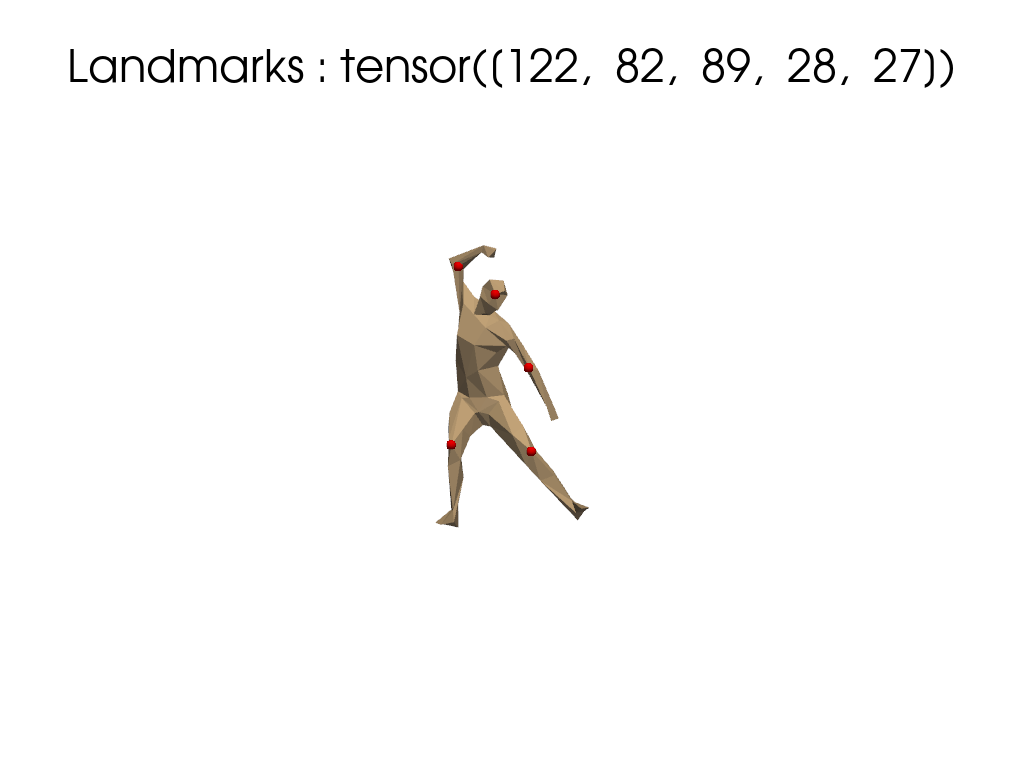
Add landmarks
Landmarks are distinguished points of the PolyData
They can be selected via an interactive application (using vedo)
Landmarks can be accessed as (n_landmarks, 3) tensors or list of indices
if not pv.BUILDING_GALLERY:
    # If not in the gallery, we can use vedo to open the landmark setter
    # Setting the default backend to vtk is necessary when running in a notebook
    import vedo
    vedo.settings.default_backend= 'vtk'
    sks.LandmarkSetter(surface_mesh).start()
else:
    # Set the landmarks manually
    surface_mesh.landmark_indices = [122,  82,  89,  28,  27]

plotter = pv.Plotter()
plotter.add_mesh(surface_mesh.to_pyvista(), color="tan")
plotter.add_points(surface_mesh.landmark_points.numpy(), color="red", point_size=10, render_points_as_spheres=True)
plotter.camera_position = cpos
plotter.add_title(f"Landmarks : {surface_mesh.landmark_indices}")
plotter.show()
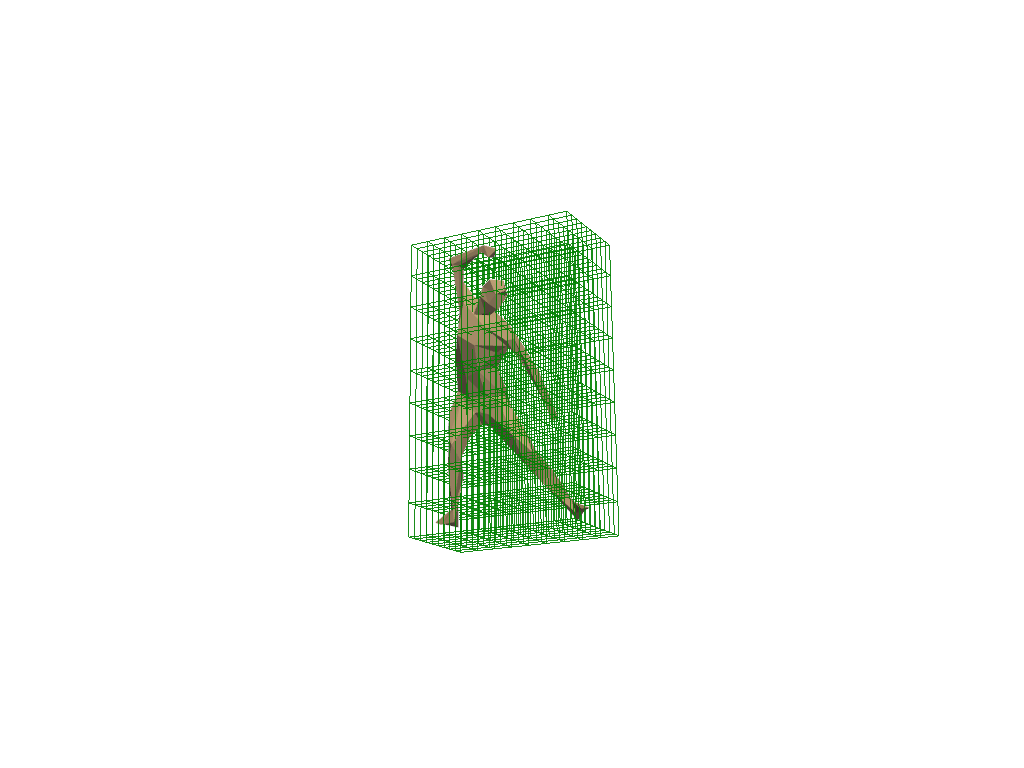
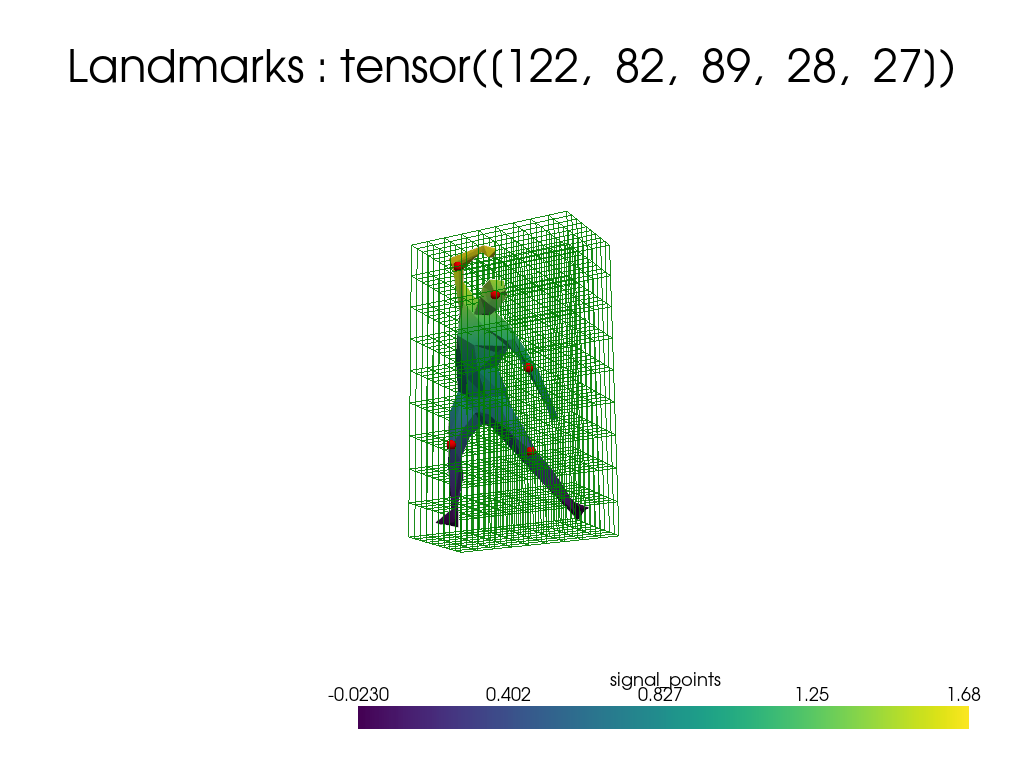
Add control points
Control points are represented by another PolyData, attached to the first
The bounding_grid method offers a standard way to define control points as regular grids
surface_mesh.control_points = surface_mesh.bounding_grid(N=10, offset=0.05)

plotter = pv.Plotter()
plotter.add_mesh(surface_mesh.to_pyvista(), color="tan")
plotter.add_mesh(surface_mesh.control_points.to_pyvista(), color="green", opacity=0.9)
plotter.camera_position = cpos
plotter.show()
Save and load
PolyData can be saved to the disk
If the file format is .vtk, signals and landmarks persist when loaded back
it is also possible to save in .stl or .obj but signals/landmarks will be lost
Control points must be saved separately
extension = ".vtk"

from pathlib import Path

filename_mesh = "tmp" + extension
filename_control_points = "tmp_control_points" + extension

surface_mesh.save(filename_mesh)
surface_mesh.control_points.save(filename_control_points)

loaded_mesh = sks.PolyData(filename_mesh)
loaded_mesh.control_points = sks.PolyData(filename_control_points)

plotter = pv.Plotter()
plotter.add_mesh(loaded_mesh.to_pyvista(), scalars="signal_points", cmap="viridis")
plotter.add_points(loaded_mesh.landmark_points.numpy(), color="red", point_size=10, render_points_as_spheres=True)
plotter.add_mesh(loaded_mesh.control_points.to_pyvista(), color="green", opacity=0.9)
plotter.camera_position = cpos
plotter.add_title(f"Landmarks : {loaded_mesh.landmark_indices}")
plotter.show()

print("Triangle_data:")
print(loaded_mesh.triangle_data)

Path.unlink(Path(filename_mesh))
Path.unlink(Path(filename_control_points))
Triangle_data:
DataAttributes Object with attributes:
- signal_triangles: torch.Size([250, 3]), torch.float32
- centers: torch.Size([250, 3]), torch.float32
- areas: torch.Size([250]), torch.float32
Number of elements: 250
Device: cpu
Total running time of the script: (0 minutes 1.569 seconds)